Since I've been getting into Machine Learning/Artificial Intelligence recently, I've been looking at various computing environments recently. Some of the contenders are:
- MATLAB - The traditional software stack for doing machine learning and statistical analysis
- GNU Octave - An open-source MATLAB clone.
- R - An open source clone of a statistical computing environment called S.
- Julia - A language for doing statistical analysis. The goals are to compete with Matlab and R.
- Matplotlib/Pylab/SciPy/NumPy - see below
Of these, I've tried Octave and Matplotlib. Matplotlib/Pylab is the software stack consisting of:
- IPython - an interactive REPL for Python with things like tab completion
- Matplotlib - a graphical plotting library
- NumPy - a matrix library
- SciPy - a collection of scientific and mathematical algorithms
I've only played with Matplotlib/Pylab a little bit, but I like what I've seen so far. Here's 2 quick examples:
1. Displaying a Histogram of a gaussian distribution
First, make sure to run from matplotlib import * and from numpy import *
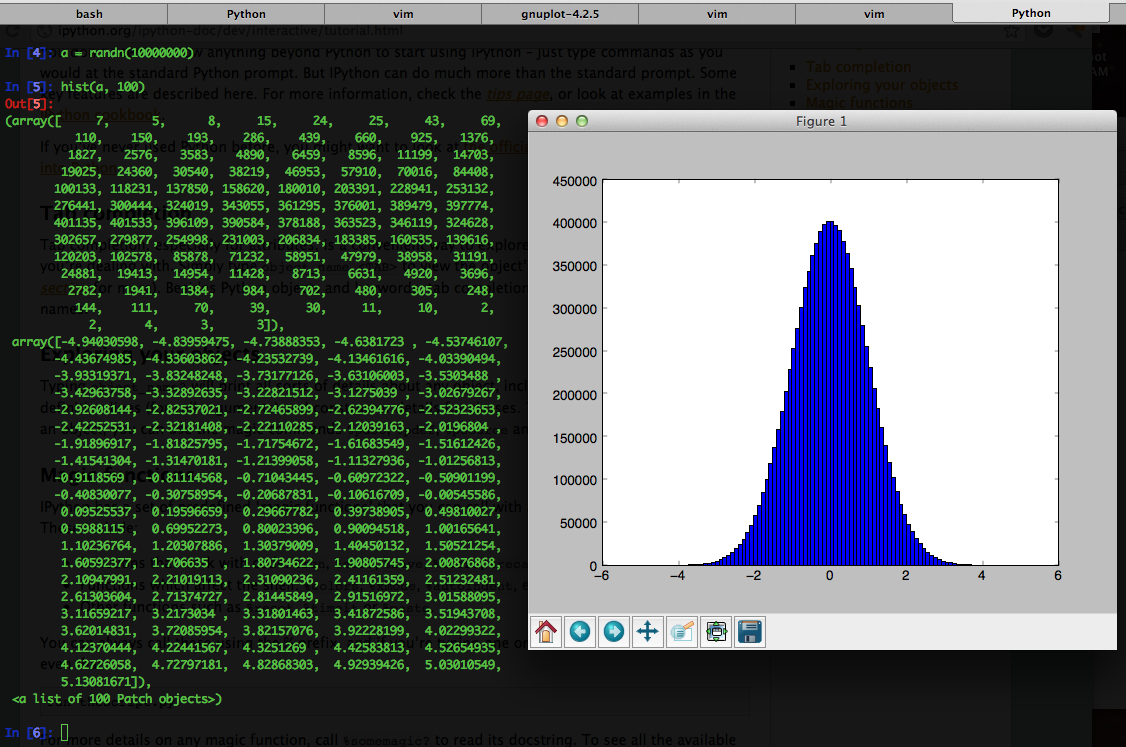
(I love how there are bell-shaped curves in the array representation of the histogram) :)
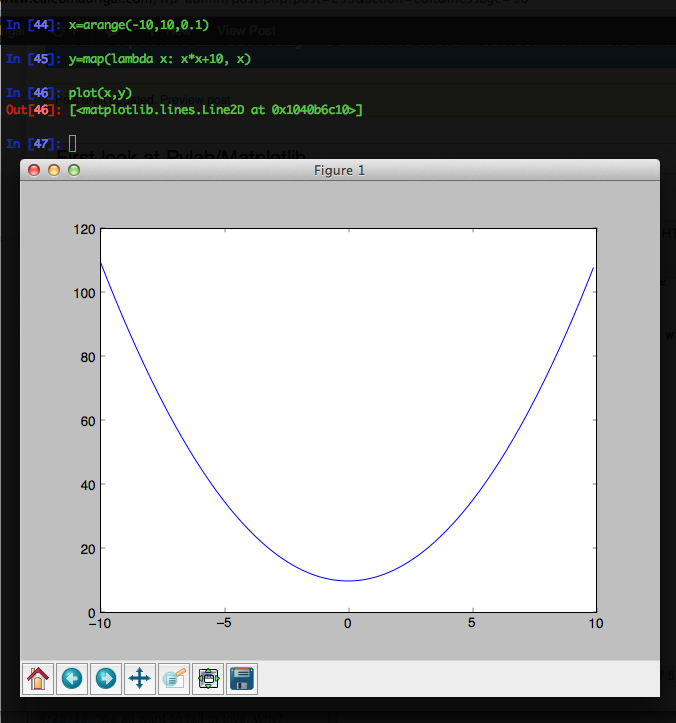
2. Plotting a function (y=x^2+10):
Also, there is a really good video from PyCon 2012 on Matplotlib: Plotting with Matplotlib.