Caleb Madrigal

Programming, Hacking, Math, and Art


Digital Radio Signal Generation

Recently, I was curious if I could generate a digital radio signal from scratch just using math, and use that signal to control this radio-controlled outlet that I have.

Here's the Github source: https://github.com/calebmadrigal/radio-hacking-scripts/blob/master/radio_signal_generation.ipynb

Generating radio signals

I want to be able to generate modulated digital signals such as this one...
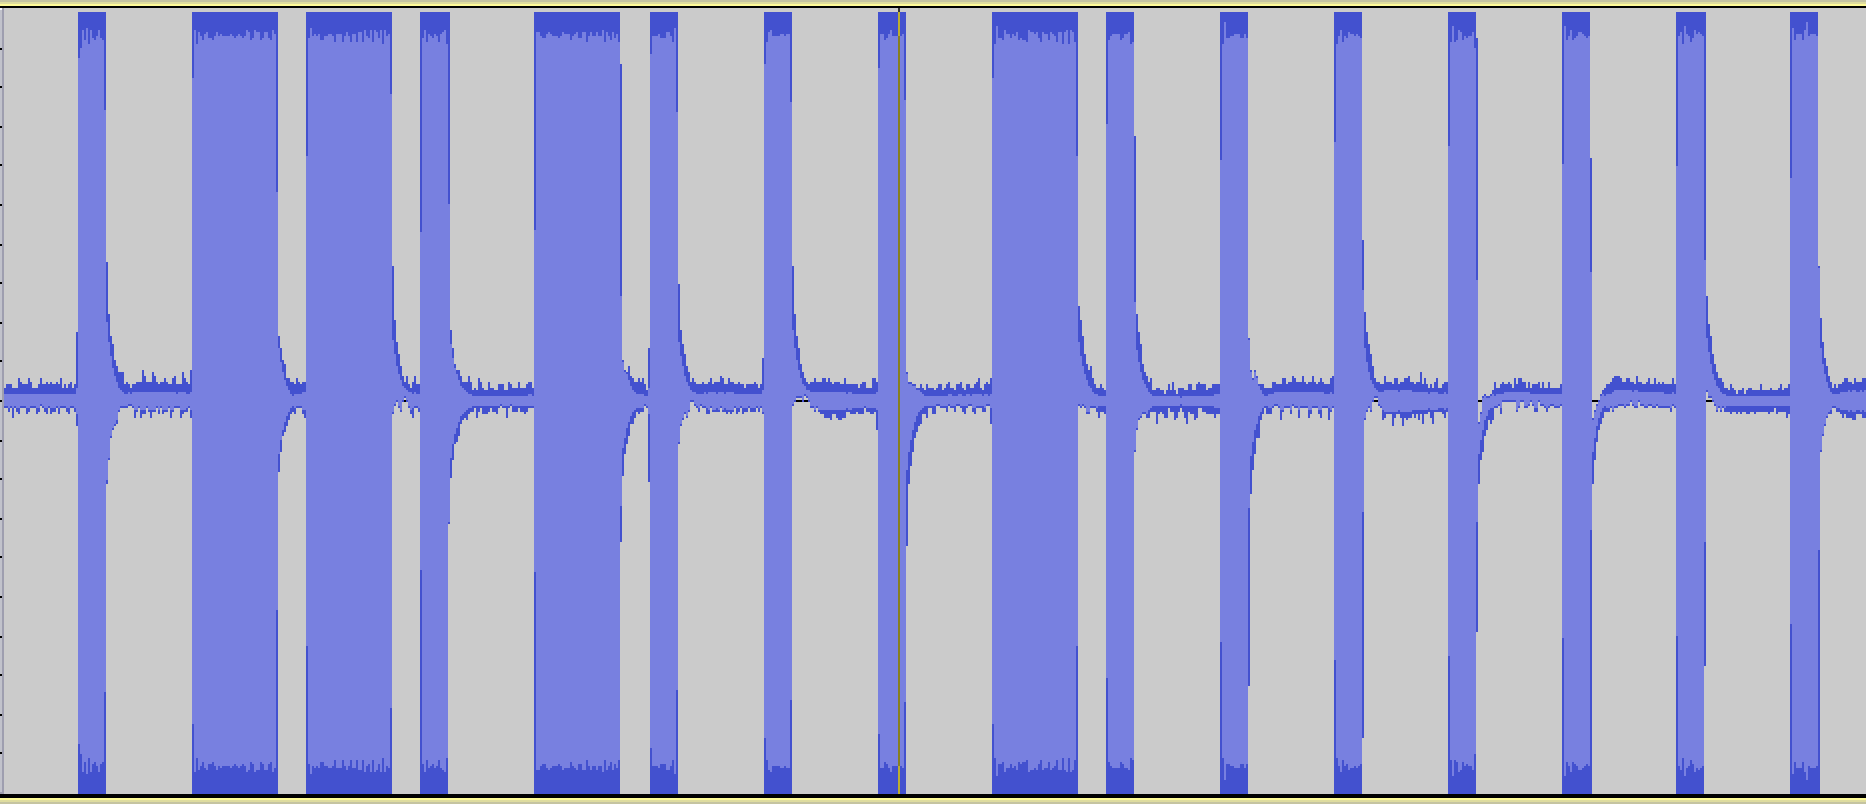
original radio signal

original radio signal

This is a binary signal coded with On-off keying (also known as Amplitude-shift keying).

I'm taking the long pulses to mean "1" and the short pulses to mean "0", so this signal is transmitting the digital code, "0110100010000000".

In [2]:
# Imports and boilerplate to make graphs look better
%matplotlib inline
import matplotlib.pyplot as plt
import numpy as np
import scipy
import wave
from ...
Fourier Transform Notes

The following are my notes from a talk I gave at OSCON 2013. Here is the Github source of these Jupyter/IPython notebooks: https://github.com/calebmadrigal/FourierTalkOSCON

Sound Analysis with the Fourier Transform and Python

Intro

  1. Welcome
  2. Format of talk
    • Everything is in iPython Notebook (on Github)
    • You don't need to take notes
    • Please save questions for the end
  3. Why this is interesting
    • Sound processing is big - natural human-machine interfaces (e.g. Siri)
    • Noise reduction, Compression, feature extraction (e.g. speech)
    • Understanding our universe better (Superposition, Harmonics, Sound timbre)

Overview

  • The Nature of Waves
  • The Fourier Transform
  • Fast Fourier Transform (FFT) in Python
  • Audio analysis

In [24]:
%matplotlib inline
import matplotlib.pyplot as plt
import numpy as np
import ...

Fuel efficiency difference cost

I recently was car shopping, and I had the question about gas mileage: "How much does, say, the difference between 25 mpg and 30 mpg cost?"

To answer this question, I did a bit of analysis using IPython Notebook...

Goal

  • To find how much different fuel efficiencies cost in terms of dollars per year.
  • I want to estimate this value for the next 10 or so years.

Assumptions

  • I'm estimating the average price per gallon of gas (over the next 10 years) to be $4.50. It is around $3.60 now, I adjusted for inflation, and counter-adjusted for the time-value of money.
  • I'm estimating that we will drive about 14,000 miles per year (based on the last 3 years).

Data

In [1]:
price_per_gallon = 4 ...

Display List as Table in IPython Notebook

IPython Notebook provides hook methods like _repr_html_ which can be defined by Python objects to allow richer representations. Here's an example:

In [1]:
class ListTable(list):
    """ Overridden list class which takes a 2-dimensional list of 
        the form [[1,2,3],[4,5,6]], and renders an HTML Table in 
        IPython Notebook. """
    
    def _repr_html_(self):
        html = ["<table>"]
        for row in self:
            html.append("<tr>")
            
            for col in row:
                html.append("<td>{0}</td>".format(col))
            
            html.append("</tr>")
        html.append("</table>")
        return ''.join(html)
In [23]:
import random
table = ListTable()
table.append(['x', 'y', 'x-y', '(x-y)^2'])
for i in xrange(7):
    x = random.uniform(0, 10)
    y = random.uniform(0, 10)
    table.append([x, y, x-y, (x-y)**2])
table
Out[23]:
xyx-y(x-y ...

How To Draw Lines With Matplotlib

Simple example to show how to draw lines with Matplotlib (in IPython Notebook).

ipython notebook --pylab inline

In [5]:
import matplotlib.lines as lines
fig, ax = plt.subplots()

fig.set_size_inches(6,6)          # Make graph square
scatter([-0.1],[-0.1],s=0.01)     # Move graph window a little left and down

line1 = [(0,0), (1,0)]
line2 = [(0,0), (0,1)]

# Note that the Line2D takes a list of x values and a list of y values,
# not 2 points as one might expect.  So we have to convert our points
# an x-list and a y-list.
(line1_xs, line1_ys) = zip(*line1)
(line2_xs, line2_ys) = zip(*line2)

ax.add_line(Line2D(line1_xs, line1_ys, linewidth=2, color='blue'))
ax.add_line(Line2D(line2_xs, line2_ys, linewidth=2, color='red'))
plot()
show()
Read On ↵

Opposite of zip function in Python

Is there a way to do the opposite of what the zip() function does? It turns out, there is - the zip() function with list unpacking...

Normal zip() usage

In [5]:
x = [1,2,3,4,5]
y = [10,20,30,40,50]
points = zip(x,y)
points
Out[5]:
[(1, 10), (2, 20), (3, 30), (4, 40), (5, 50)]

Reverse of normal zip() with list unpacking

By using list unpacking (by using the asterisk before the list), zip can effectively act in reverse...

In [6]:
zip(*points)
Out[6]:
[(1, 2, 3, 4, 5), (10, 20, 30, 40, 50)]

Example of usefulness

In [19]:
import random
rand = lambda: random.gauss(mu=1, sigma=1)
points = [(rand(), rand()) for i in xrange(1000)]

# Make the graph square
fig = plt ...

Monte Carlo In Python

Monte Carlo Estimation of Area

Monte Carlo Estimation

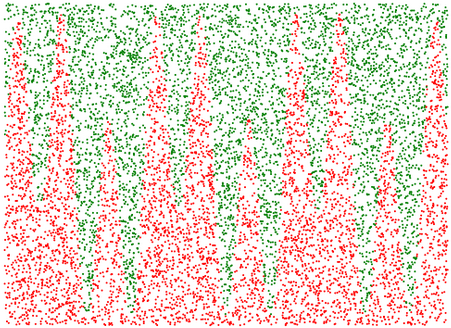
Monte Carlo Estimation is a method of numerically estimating things which we don't (or can't) calculate numerically by randomly generating samples. In this IPython Notebook, I'm going to use Monte Carlo Estimation to estimate:

  1. The area under a curve
  2. The value of \(\pi\)

Monte Carlo Estimation of Area

Let's use Monte Carlo Estimation to estimate the area onder this curve (from 0 to 10):

\[y = 5 * \sin(6~x) + \sin(2~x) + 7\]

Here are the basic steps:

  1. Define a rectangle which encloses the part of the curve for which we want to find area.
  2. Randomly generate points within that region.
  3. Find which of the randomly generated points are under the curve by checking them against the equation of the function ...

Wordpress to Pelican Reasons

I recently migrated my blog from Wordpress to Pelican. Pelican is a static-site generating blog system which is written in Python and uses Jinja2 for templating. I'll probably do a post about the migration process later, but for now, I'll just give my reasons for moving to Pelican...

Data Longevity

I didn't want my blog data stored in a database; I vastly prefer it being stored in version-controlled Markdown format.

Markdown

  • I wanted to write blog posts in Markdown (which is possible in Wordpress, but Wordpress isn't designed to use Markdown).
  • I also get to use vim to write my blog posts now, which is much nicer than the Wordpress editor.

Language

  • I hate PHP, but love Python. It worried me that my blog ...

IPython Notebook on a VPS

Overview

This is a guide to set up IPython Notebook on a Server - specifically, on a DigitalOcean VPS. This will allow you to access your iPython Notebooks from anywhere.

Overview of Steps:

  • Set up a domain name
  • Get a VPS
  • Install IPython Notebook (and all dependencies)
  • Configure IPython Notebook to run in a server mode
  • Add SSL
  • Make IPython Notebook start automatically

Create a domain

Go to http://freedns.afraid.org and click "Setup an account here" Go through the signup form Click on the activation link they send to your email This will bring you back to their site; Click the link you see there called "Add a subdomain" Here is how I filled out the form:

Create Domain

Notes:

  • Leave the Destination alone for now, and leave the ...

Big graphs in IPython Notebook

I've been doing a good bit of graphing in IPython Notebook recently, and I often wanted to make the graphs larger. I also often wanted to label the graph axes. So I wrote this simple function and have been using it a lot.

# Graphing helper function
def setup_graph(title='', x_label='', y_label='', fig_size=None):
    fig = plt.figure()
    if fig_size != None:
        fig.set_size_inches(fig_size[0], fig_size[1])
    ax = fig.add_subplot(111)
    ax.set_title(title)
    ax.set_xlabel(x_label)
    ax.set_ylabel(y_label)

Here's a demo of using it...

In [27]:
x = linspace(0, 2 * pi, 1000)
y = 5 * sin(1 * 2*pi*x) + 4 * sin(2 * 2*pi*x)

Without setup_graph()

In [24]:
_ = plot(x, y)
Read On ↵

Finding the Golden Ratio

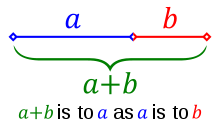
I recently was exploring the Golden Ratio. I was really surprised what a simple (and recursive) relationship it comes from:

golden_ratio

Starting with this this image, here is the derivation of the golden ratio...

From this relationship we see in this image, we can derive this equation: \[\frac{a}{b} = \frac{a+b}{a}\]

And if we then let b=1 (so we can find the ratio of a to 1), we get: \[a = \frac{a+1}{a}\]

Then, with this formula, we can define a function: \[f(a) = \frac{a+1}{a}\]

If we then find the fixed-point in this function (so that f(x) = x), then we will have found a solution to \[a = \frac{a+1}{a}\]

A simple way to think about the fixed-point of ...

How to graph with IPython Notebook

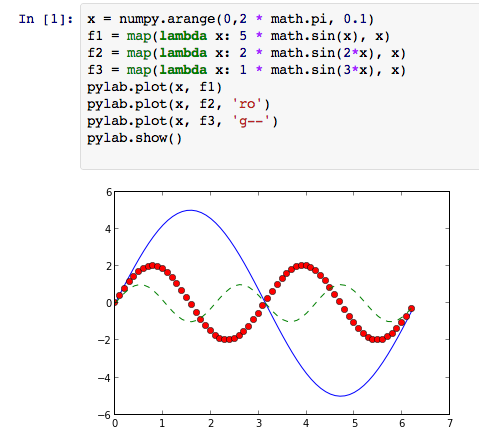
IPython Notebook / Matplotlib / Pylab / Numpy is great for graphing (among other things). Below is a simple demo of how to graph with it.

To run IPython Notebook, use this command: ipython notebook --pylab inline

Here's a screenshot:

IPython Notebook Example

Here's an embedded IPython Notebook showing a slightly easier way:

In [5]:
x = linspace(0, 2*pi, 42)
f1 = 5 * sin(x)
f2 = 2 * sin(2*x)
f3 = 1 * sin(3*x)
plot(x, f1)
plot(x, f2, 'ro')
plot(x, f3, 'g--')
show()
Read On ↵