IPython Notebook / Matplotlib / Pylab / Numpy is great for graphing (among other things). Below is a simple demo of how to graph with it.
To run IPython Notebook, use this command: ipython notebook --pylab inline
Here's a screenshot:
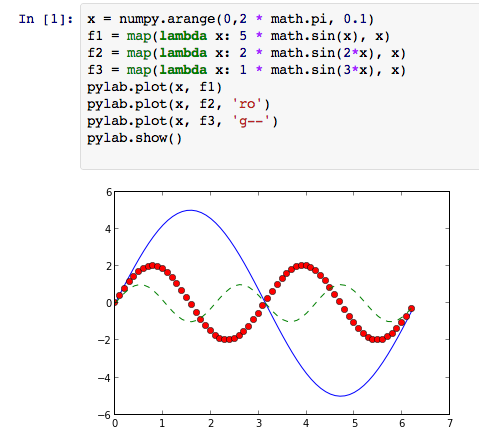
Here's an embedded IPython Notebook showing a slightly easier way:
In [5]:
x = linspace(0, 2*pi, 42)
f1 = 5 * sin(x)
f2 = 2 * sin(2*x)
f3 = 1 * sin(3*x)
plot(x, f1)
plot(x, f2, 'ro')
plot(x, f3, 'g--')
show()

Note: using the --pylab argument makes python automatically import a number of modeules, so that I can do things like just writing pi instead of math.pi. Also, sin() is the scipy.sin() function, which can take a numpy array as an argument, so that I don't have to do a map() or list comprehension to apply the function to each item in x.