Caleb Madrigal

Programming, Hacking, Math, and Art


Truthy Graph

One time, I was looking at a graph, and the thought occurred to me, "this graph shows where the two sides of this equation are exactly equal, but what if a graph showed also where they were almost the same?", so I wrote a little graphing web app: https://truthygraph.github.io/.

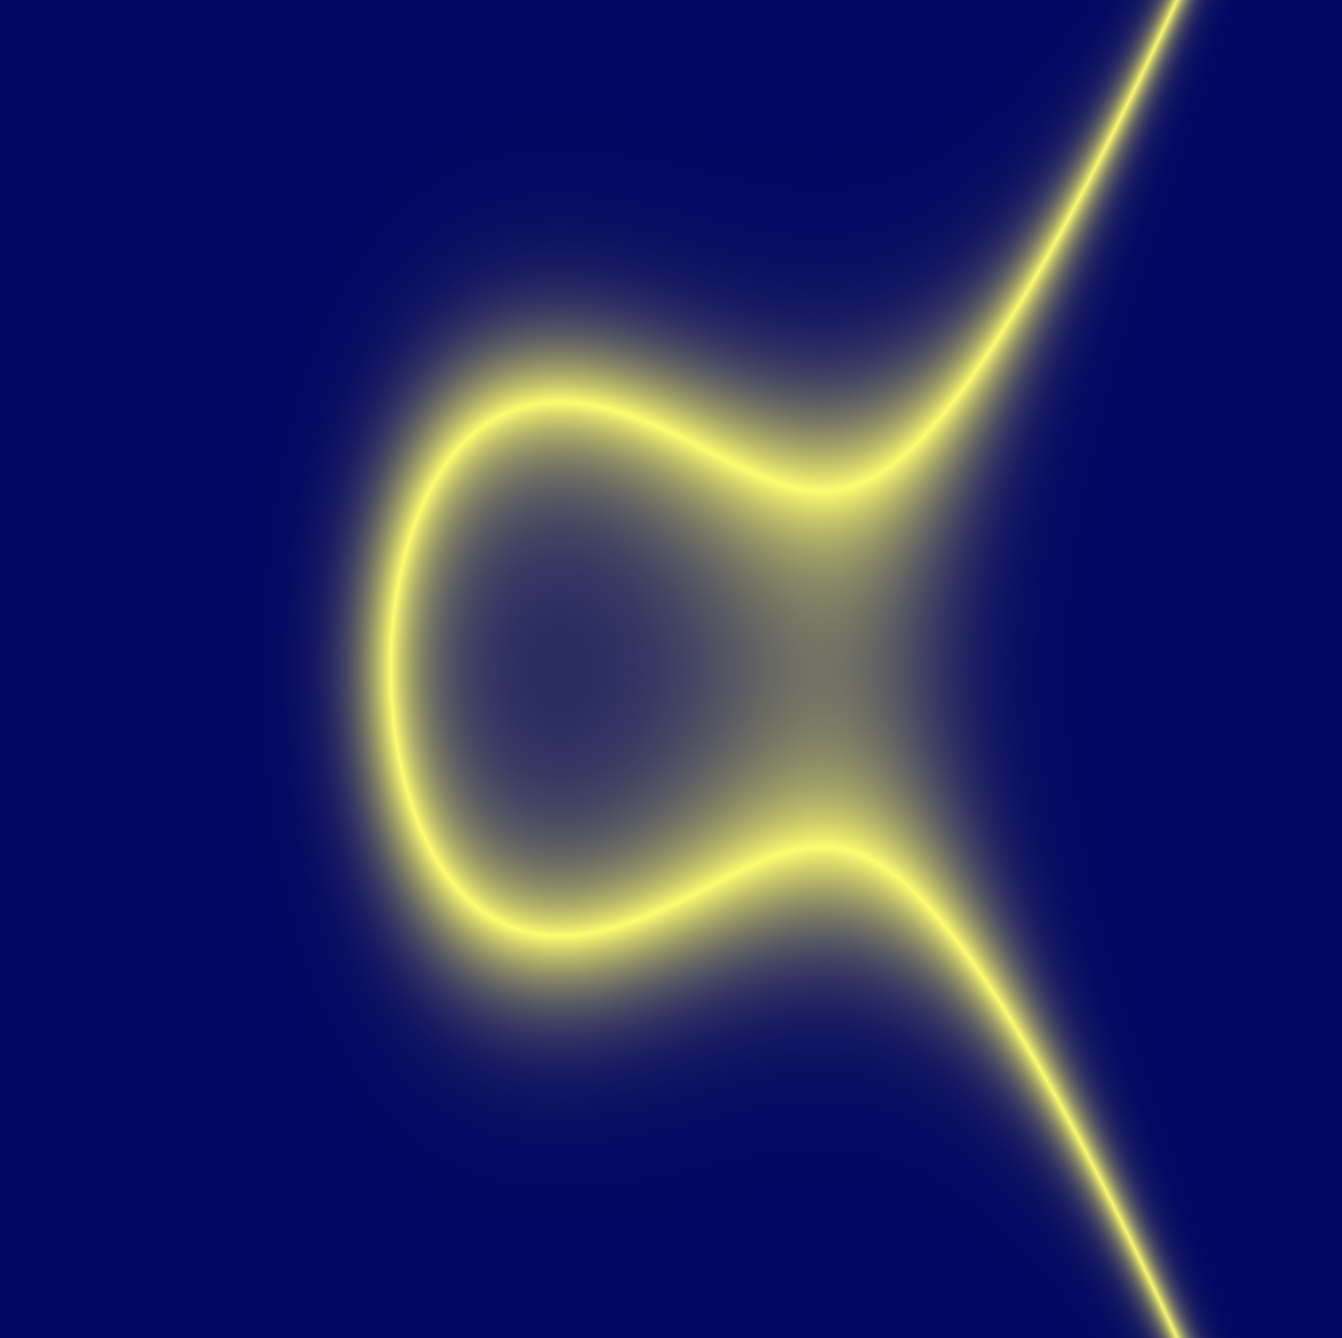
I called it "Truthy Graph", since it shows where the 2 sides of the equation are nearly true. I think some interesting shapes show up. Here's a few screenshots:

sin(3x)

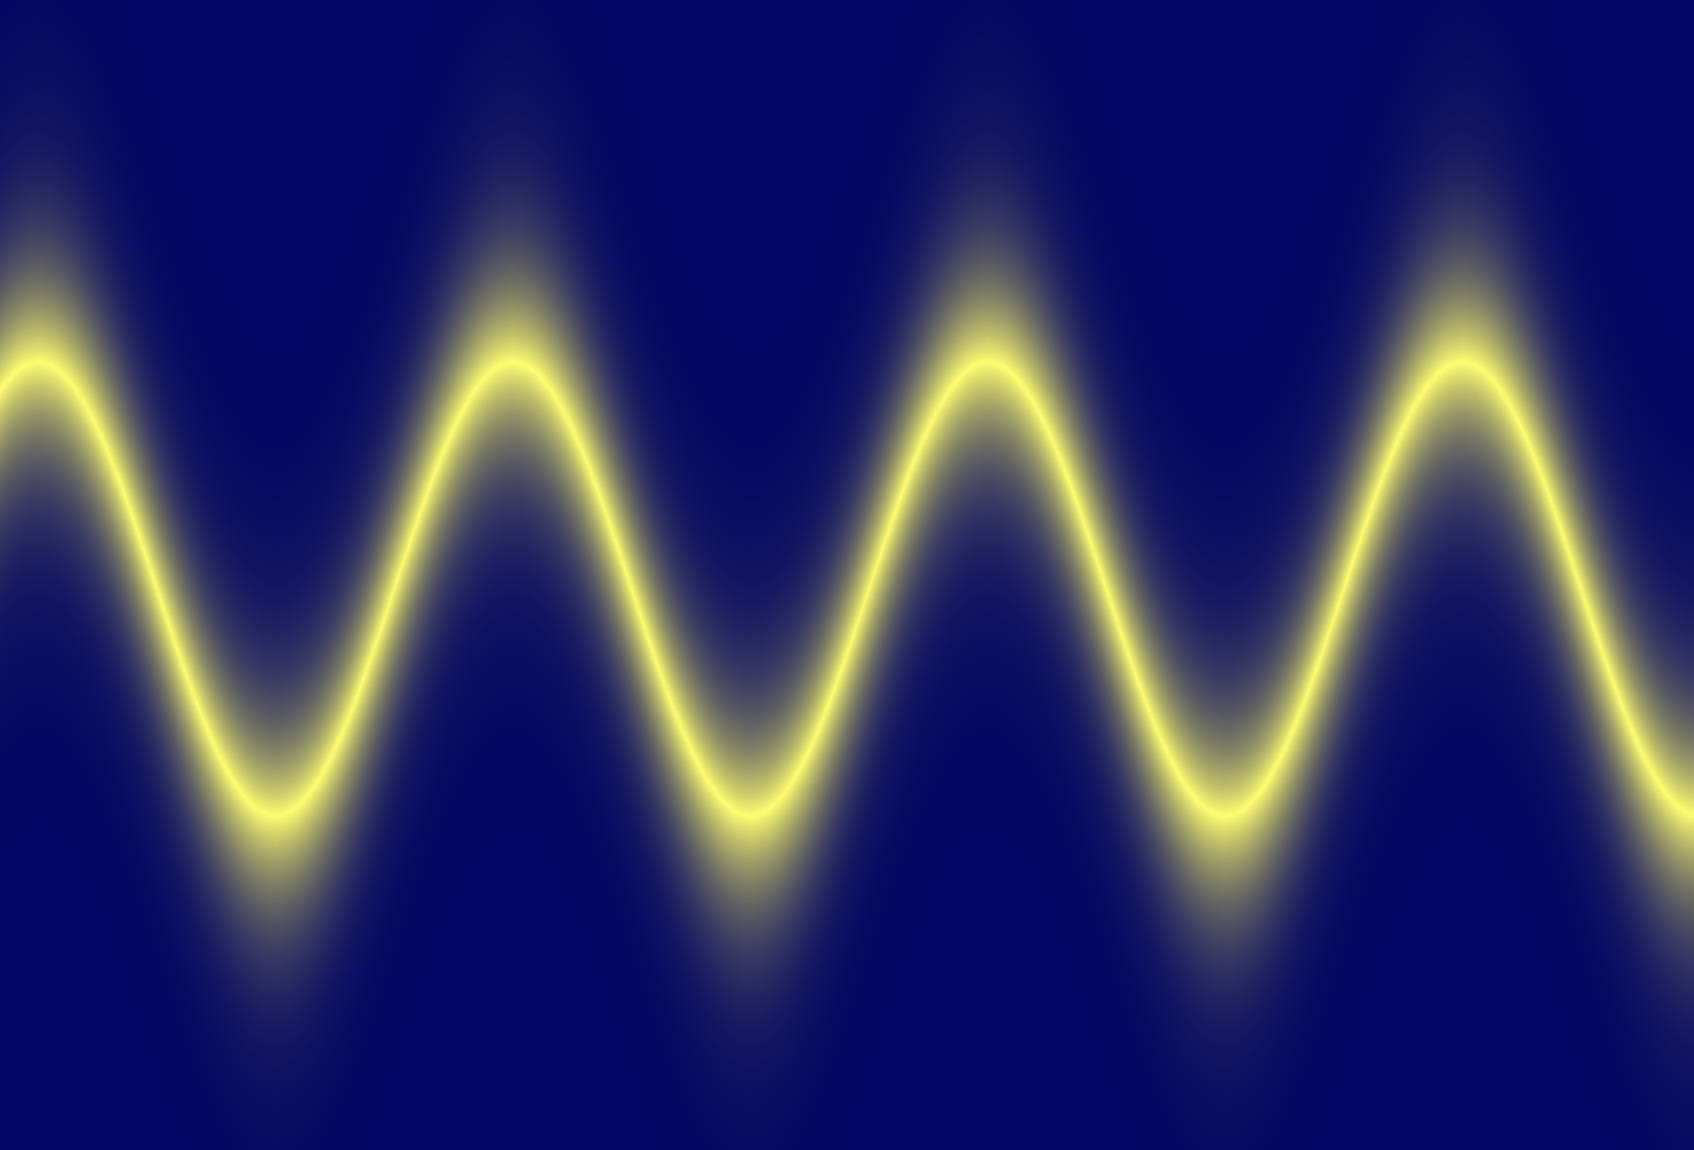
Another cool thing, is that either side of the equation can use the 'y' or 'x' variables in any way (calling functions like sin, can be squared, etc - the equations need not follow the 'y=' formula). Example:

Elliptic curve

I'm aware there are a few bugs (especially ...

Fourier Transform Notes

The following are my notes from a talk I gave at OSCON 2013. Here is the Github source of these Jupyter/IPython notebooks: https://github.com/calebmadrigal/FourierTalkOSCON

Sound Analysis with the Fourier Transform and Python

Intro

  1. Welcome
  2. Format of talk
    • Everything is in iPython Notebook (on Github)
    • You don't need to take notes
    • Please save questions for the end
  3. Why this is interesting
    • Sound processing is big - natural human-machine interfaces (e.g. Siri)
    • Noise reduction, Compression, feature extraction (e.g. speech)
    • Understanding our universe better (Superposition, Harmonics, Sound timbre)

Overview

  • The Nature of Waves
  • The Fourier Transform
  • Fast Fourier Transform (FFT) in Python
  • Audio analysis

In [24]:
%matplotlib inline
import matplotlib.pyplot as plt
import numpy as np
import ...

Fuel efficiency difference cost

I recently was car shopping, and I had the question about gas mileage: "How much does, say, the difference between 25 mpg and 30 mpg cost?"

To answer this question, I did a bit of analysis using IPython Notebook...

Goal

  • To find how much different fuel efficiencies cost in terms of dollars per year.
  • I want to estimate this value for the next 10 or so years.

Assumptions

  • I'm estimating the average price per gallon of gas (over the next 10 years) to be $4.50. It is around $3.60 now, I adjusted for inflation, and counter-adjusted for the time-value of money.
  • I'm estimating that we will drive about 14,000 miles per year (based on the last 3 years).

Data

In [1]:
price_per_gallon = 4 ...

Monte Carlo In Python

Monte Carlo Estimation of Area

Monte Carlo Estimation

Monte Carlo Estimation is a method of numerically estimating things which we don't (or can't) calculate numerically by randomly generating samples. In this IPython Notebook, I'm going to use Monte Carlo Estimation to estimate:

  1. The area under a curve
  2. The value of \(\pi\)

Monte Carlo Estimation of Area

Let's use Monte Carlo Estimation to estimate the area onder this curve (from 0 to 10):

\[y = 5 * \sin(6~x) + \sin(2~x) + 7\]

Here are the basic steps:

  1. Define a rectangle which encloses the part of the curve for which we want to find area.
  2. Randomly generate points within that region.
  3. Find which of the randomly generated points are under the curve by checking them against the equation of the function ...

Finding the Golden Ratio

I recently was exploring the Golden Ratio. I was really surprised what a simple (and recursive) relationship it comes from:

golden_ratio

Starting with this this image, here is the derivation of the golden ratio...

From this relationship we see in this image, we can derive this equation: \[\frac{a}{b} = \frac{a+b}{a}\]

And if we then let b=1 (so we can find the ratio of a to 1), we get: \[a = \frac{a+1}{a}\]

Then, with this formula, we can define a function: \[f(a) = \frac{a+1}{a}\]

If we then find the fixed-point in this function (so that f(x) = x), then we will have found a solution to \[a = \frac{a+1}{a}\]

A simple way to think about the fixed-point of ...

Pyknon Intro, Chords, and Intervals

I've continued on my (hopefully) short-term fascination with music+math (it's fun, but really bad for productivity). So I found this great library for generating music in Python called Pyknon. And it can be installed using pip: pip install pyknon.

I wrote a little python script just to help me understand some concepts in music theory like intervals and chords. It is meant to be read top to bottom (which is why I intersperse functions and variables throughout). It is NOT written in good modular form (in general, I don't recommend writing python like this). This code can also be used as an intro to the pyknon library.

Behold:

from pyknon.genmidi import Midi
from pyknon.music import NoteSeq, Note, Rest

####### First we'll generate ...

Music Theory and Math Notes

For the last day, I've done some reading on music theory (trying to understand why things are the way they are in terms of math). Here are my raw unedited notes:

Important musical ratios:

  • Unison: 1:1 frequency
  • Octave: 2:1 frequency
    • 12 semitone increase
  • Fifth: 3:2 frequency (i.e. multiply by 1.5)
    • 7 semitone increase
  • Semitone: 2^(1./12) (12th root of 2) - about 1.059 - this is the "half-step" distance, so you can multiply the frequency of F by 1.059 to get the frequency for F#

Scales and keys

  • Chromatic scale: 12 notes (list of all semitones in an octave)
  • Diatomic scale: 7 notes
  • To be in a "key" (like C-major) means to select 7 notes from the 12 notes in the ...

First look at Pylab/Matplotlib

Since I've been getting into Machine Learning/Artificial Intelligence recently, I've been looking at various computing environments recently. Some of the contenders are:

  • MATLAB - The traditional software stack for doing machine learning and statistical analysis
  • GNU Octave - An open-source MATLAB clone.
  • R - An open source clone of a statistical computing environment called S.
  • Julia - A language for doing statistical analysis. The goals are to compete with Matlab and R.
  • Matplotlib/Pylab/SciPy/NumPy - see below

Of these, I've tried Octave and Matplotlib. Matplotlib/Pylab is the software stack consisting of:

  • IPython - an interactive REPL for Python with things like tab completion
  • Matplotlib - a graphical plotting library
  • NumPy - a matrix library
  • SciPy - a collection of scientific and mathematical algorithms

I've only played with Matplotlib/Pylab ...