Recently, I was curious if I could generate a digital radio signal from scratch just using math, and use that signal to control this radio-controlled outlet that I have.
Here's the Github source: https://github.com/calebmadrigal/radio-hacking-scripts/blob/master/radio_signal_generation.ipynb
Generating radio signals
I want to be able to generate modulated digital signals such as this one...
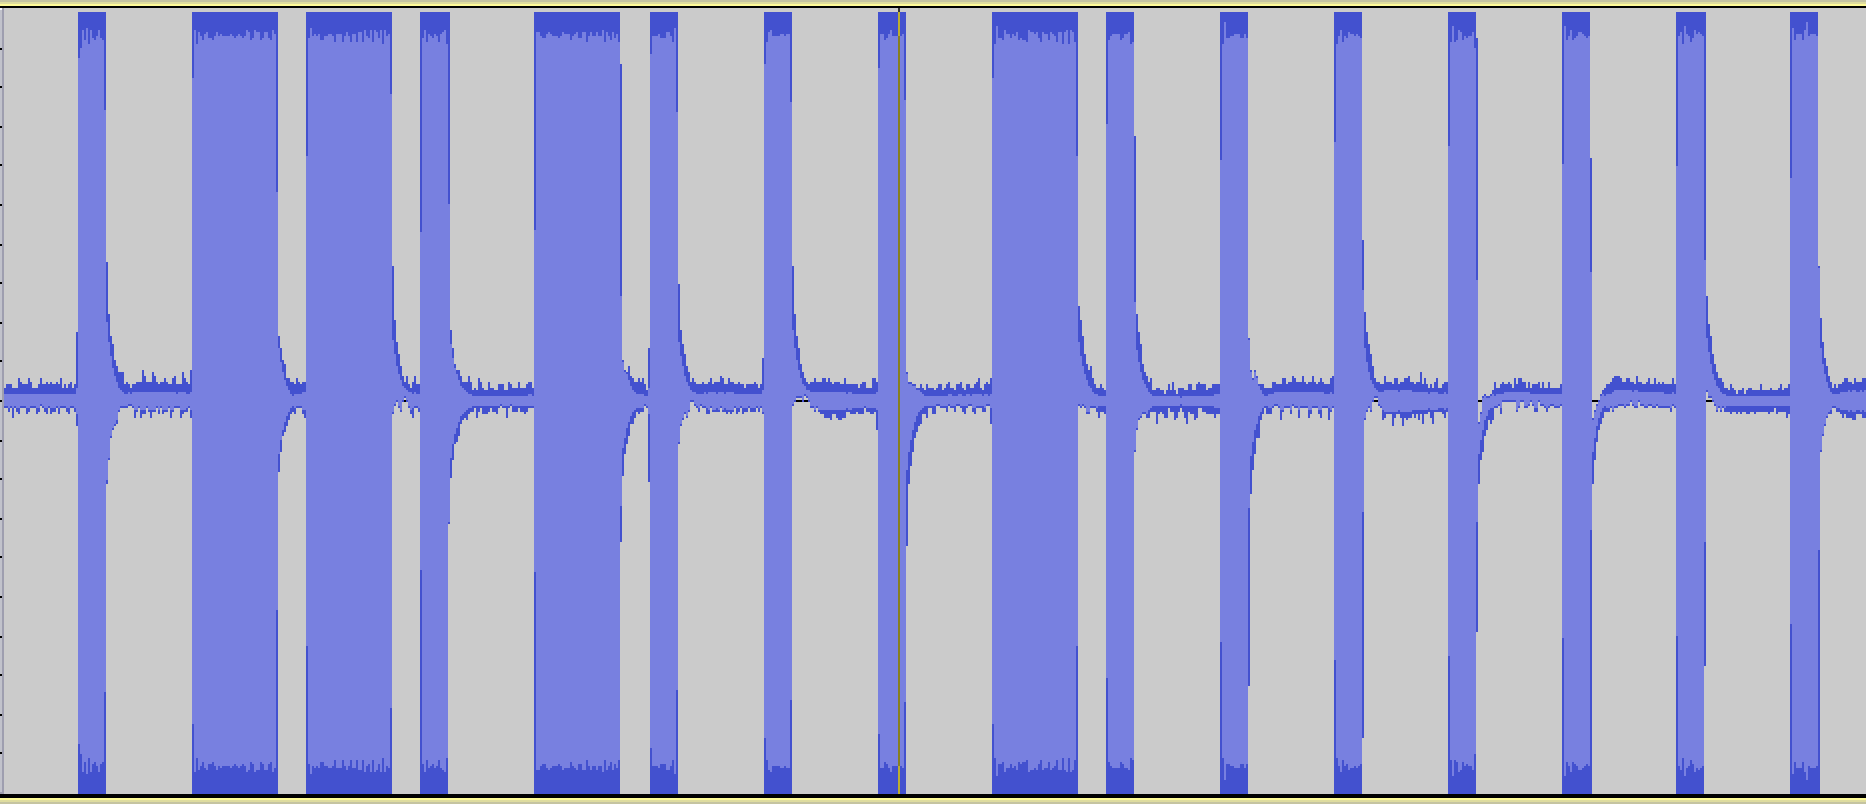
original radio signal
This is a binary signal coded with On-off keying (also known as Amplitude-shift keying).
I'm taking the long pulses to mean "1" and the short pulses to mean "0", so this signal is transmitting the digital code, "0110100010000000".
In [2]:
# Imports and boilerplate to make graphs look better
%matplotlib inline
import matplotlib.pyplot as plt
import numpy as np
import scipy
import wave
from ...
 Read On ↵
 Read On ↵