One time, I was looking at a graph, and the thought occurred to me, "this graph shows where the two sides of this equation are exactly equal, but what if a graph showed also where they were almost the same?", so I wrote a little graphing web app: https://truthygraph.github.io/.
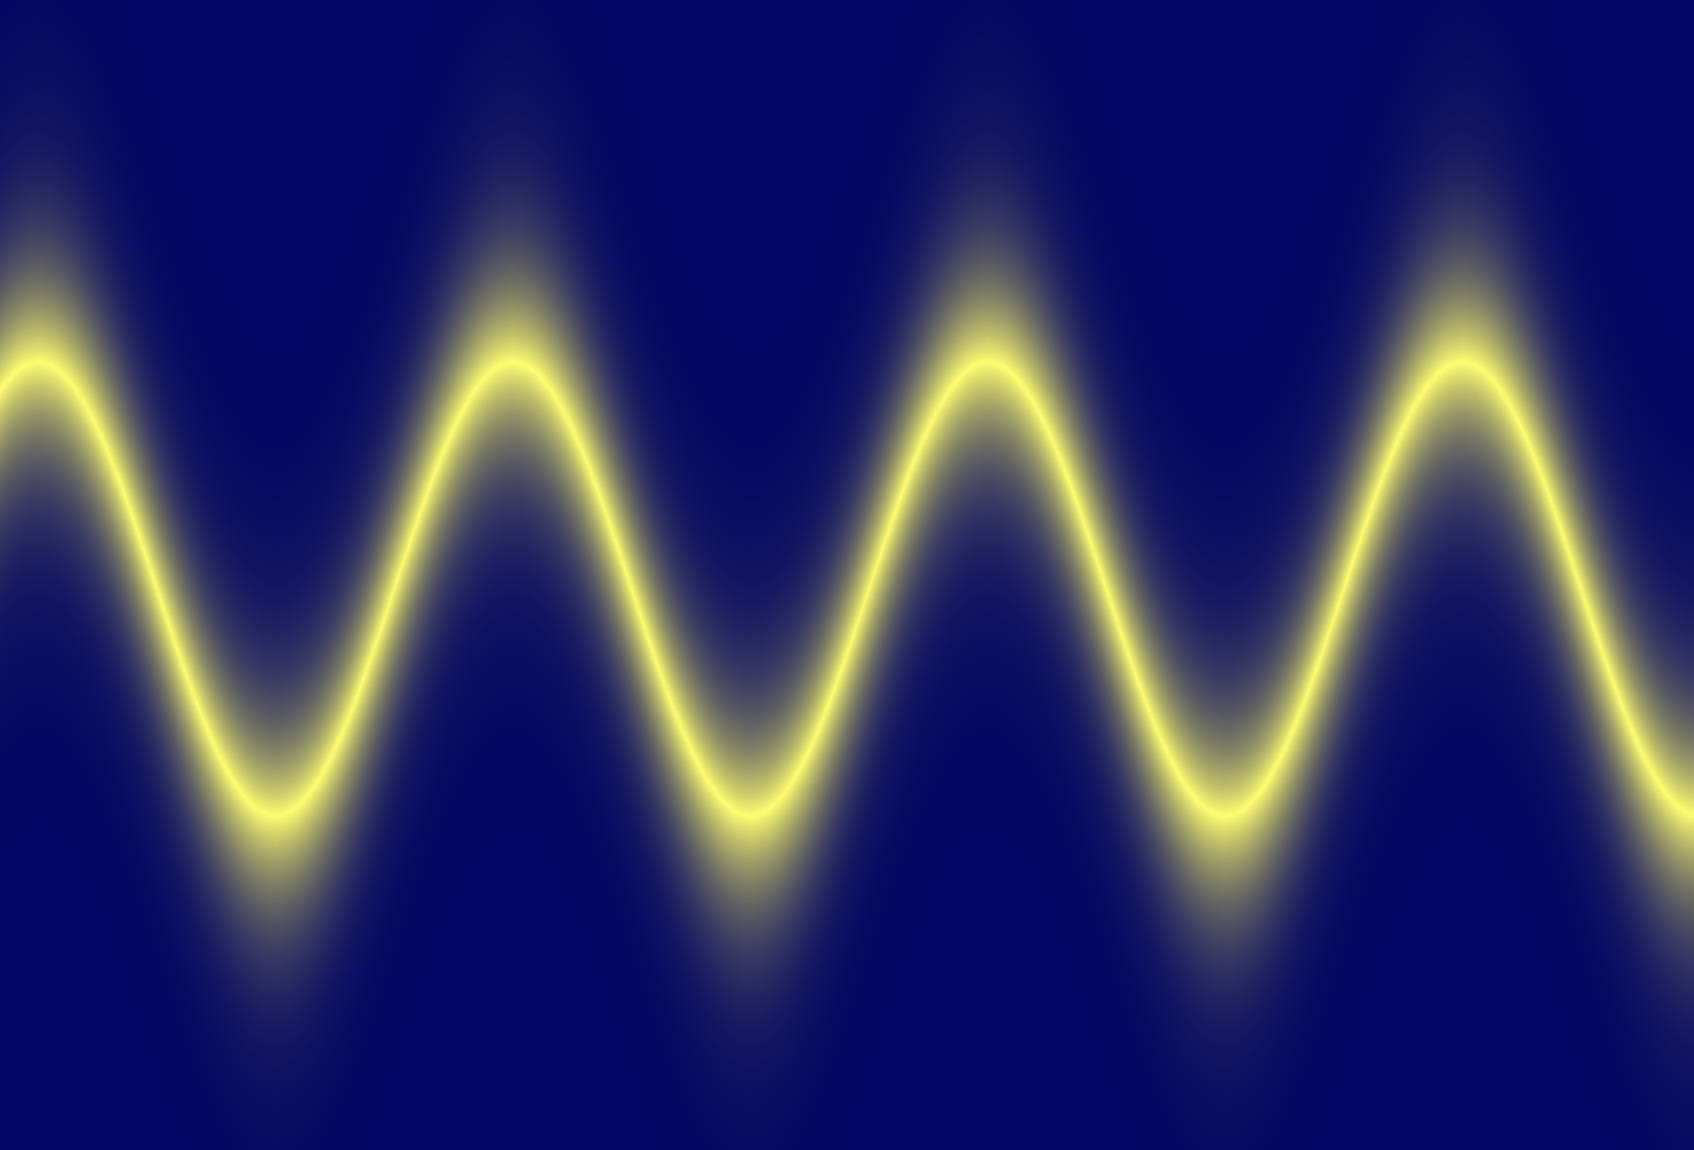
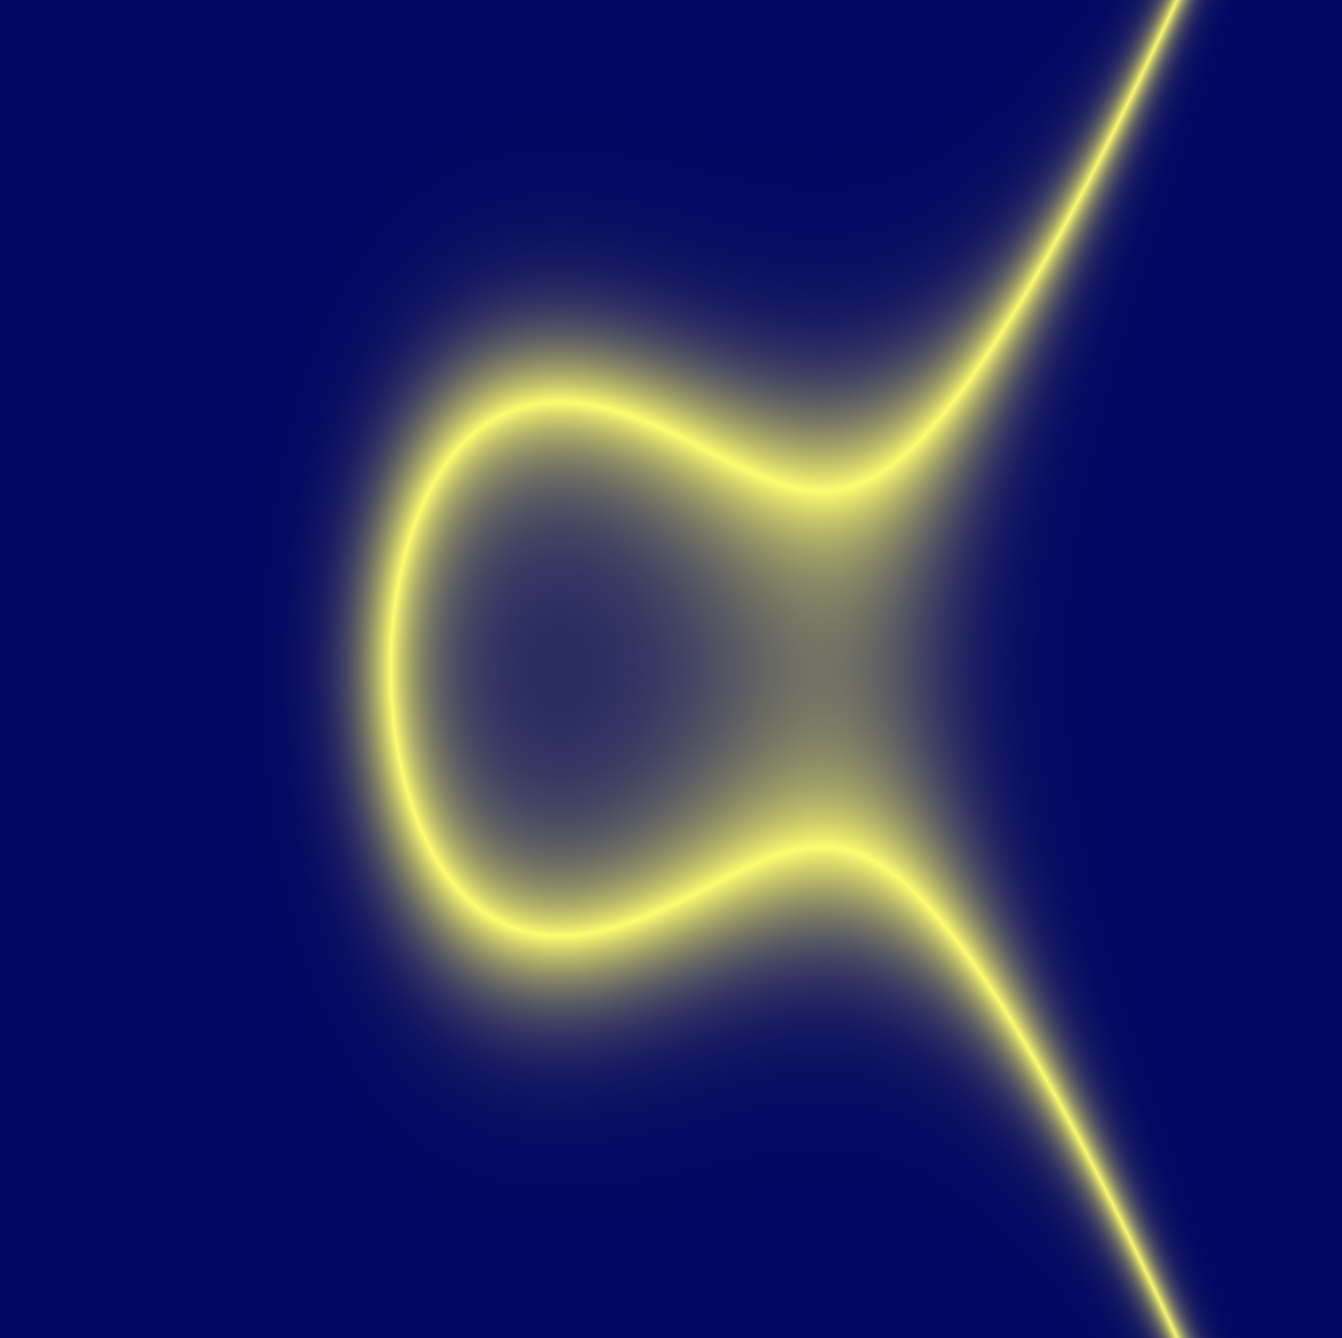
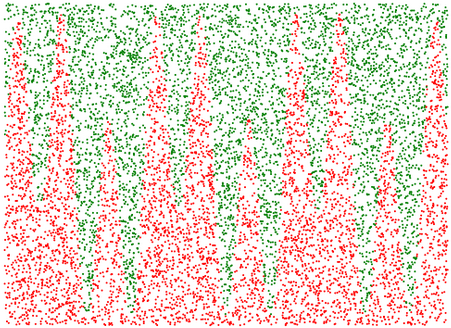
I called it "Truthy Graph", since it shows where the 2 sides of the equation are nearly true. I think some interesting shapes show up. Here's a few screenshots:

Another cool thing, is that either side of the equation can use the 'y' or 'x' variables in any way (calling functions like sin, can be squared, etc - the equations need not follow the 'y=' formula). Example:

I'm aware there are a few bugs (especially ...

