Caleb Madrigal

Programming, Hacking, Math, and Art


Fuel efficiency difference cost

I recently was car shopping, and I had the question about gas mileage: "How much does, say, the difference between 25 mpg and 30 mpg cost?"

To answer this question, I did a bit of analysis using IPython Notebook...

Goal

  • To find how much different fuel efficiencies cost in terms of dollars per year.
  • I want to estimate this value for the next 10 or so years.

Assumptions

  • I'm estimating the average price per gallon of gas (over the next 10 years) to be $4.50. It is around $3.60 now, I adjusted for inflation, and counter-adjusted for the time-value of money.
  • I'm estimating that we will drive about 14,000 miles per year (based on the last 3 years).

Data

In [1]:
price_per_gallon = 4 ...

How To Draw Lines With Matplotlib

Simple example to show how to draw lines with Matplotlib (in IPython Notebook).

ipython notebook --pylab inline

In [5]:
import matplotlib.lines as lines
fig, ax = plt.subplots()

fig.set_size_inches(6,6)          # Make graph square
scatter([-0.1],[-0.1],s=0.01)     # Move graph window a little left and down

line1 = [(0,0), (1,0)]
line2 = [(0,0), (0,1)]

# Note that the Line2D takes a list of x values and a list of y values,
# not 2 points as one might expect.  So we have to convert our points
# an x-list and a y-list.
(line1_xs, line1_ys) = zip(*line1)
(line2_xs, line2_ys) = zip(*line2)

ax.add_line(Line2D(line1_xs, line1_ys, linewidth=2, color='blue'))
ax.add_line(Line2D(line2_xs, line2_ys, linewidth=2, color='red'))
plot()
show()
Read On ↵

IPython Notebook on a VPS

Overview

This is a guide to set up IPython Notebook on a Server - specifically, on a DigitalOcean VPS. This will allow you to access your iPython Notebooks from anywhere.

Overview of Steps:

  • Set up a domain name
  • Get a VPS
  • Install IPython Notebook (and all dependencies)
  • Configure IPython Notebook to run in a server mode
  • Add SSL
  • Make IPython Notebook start automatically

Create a domain

Go to http://freedns.afraid.org and click "Setup an account here" Go through the signup form Click on the activation link they send to your email This will bring you back to their site; Click the link you see there called "Add a subdomain" Here is how I filled out the form:

Create Domain

Notes:

  • Leave the Destination alone for now, and leave the ...

Big graphs in IPython Notebook

I've been doing a good bit of graphing in IPython Notebook recently, and I often wanted to make the graphs larger. I also often wanted to label the graph axes. So I wrote this simple function and have been using it a lot.

# Graphing helper function
def setup_graph(title='', x_label='', y_label='', fig_size=None):
    fig = plt.figure()
    if fig_size != None:
        fig.set_size_inches(fig_size[0], fig_size[1])
    ax = fig.add_subplot(111)
    ax.set_title(title)
    ax.set_xlabel(x_label)
    ax.set_ylabel(y_label)

Here's a demo of using it...

In [27]:
x = linspace(0, 2 * pi, 1000)
y = 5 * sin(1 * 2*pi*x) + 4 * sin(2 * 2*pi*x)

Without setup_graph()

In [24]:
_ = plot(x, y)
Read On ↵

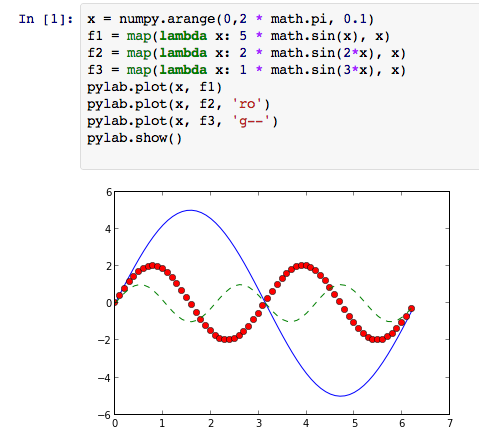
How to graph with IPython Notebook

IPython Notebook / Matplotlib / Pylab / Numpy is great for graphing (among other things). Below is a simple demo of how to graph with it.

To run IPython Notebook, use this command: ipython notebook --pylab inline

Here's a screenshot:

IPython Notebook Example

Here's an embedded IPython Notebook showing a slightly easier way:

In [5]:
x = linspace(0, 2*pi, 42)
f1 = 5 * sin(x)
f2 = 2 * sin(2*x)
f3 = 1 * sin(3*x)
plot(x, f1)
plot(x, f2, 'ro')
plot(x, f3, 'g--')
show()
Read On ↵

First look at Pylab/Matplotlib

Since I've been getting into Machine Learning/Artificial Intelligence recently, I've been looking at various computing environments recently. Some of the contenders are:

  • MATLAB - The traditional software stack for doing machine learning and statistical analysis
  • GNU Octave - An open-source MATLAB clone.
  • R - An open source clone of a statistical computing environment called S.
  • Julia - A language for doing statistical analysis. The goals are to compete with Matlab and R.
  • Matplotlib/Pylab/SciPy/NumPy - see below

Of these, I've tried Octave and Matplotlib. Matplotlib/Pylab is the software stack consisting of:

  • IPython - an interactive REPL for Python with things like tab completion
  • Matplotlib - a graphical plotting library
  • NumPy - a matrix library
  • SciPy - a collection of scientific and mathematical algorithms

I've only played with Matplotlib/Pylab ...